You can export a CSV file (spreadsheet) from any chart. This allows you to download the data for further analysis in tools like Excel.
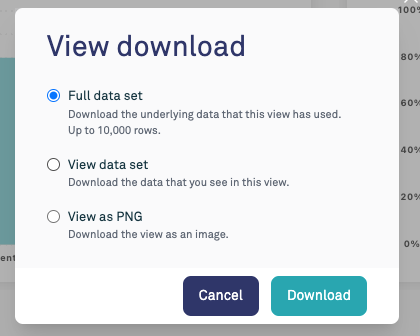
You can choose whether to export the entire underlying dataset, or to export the aggregated metrics shown on the chart.
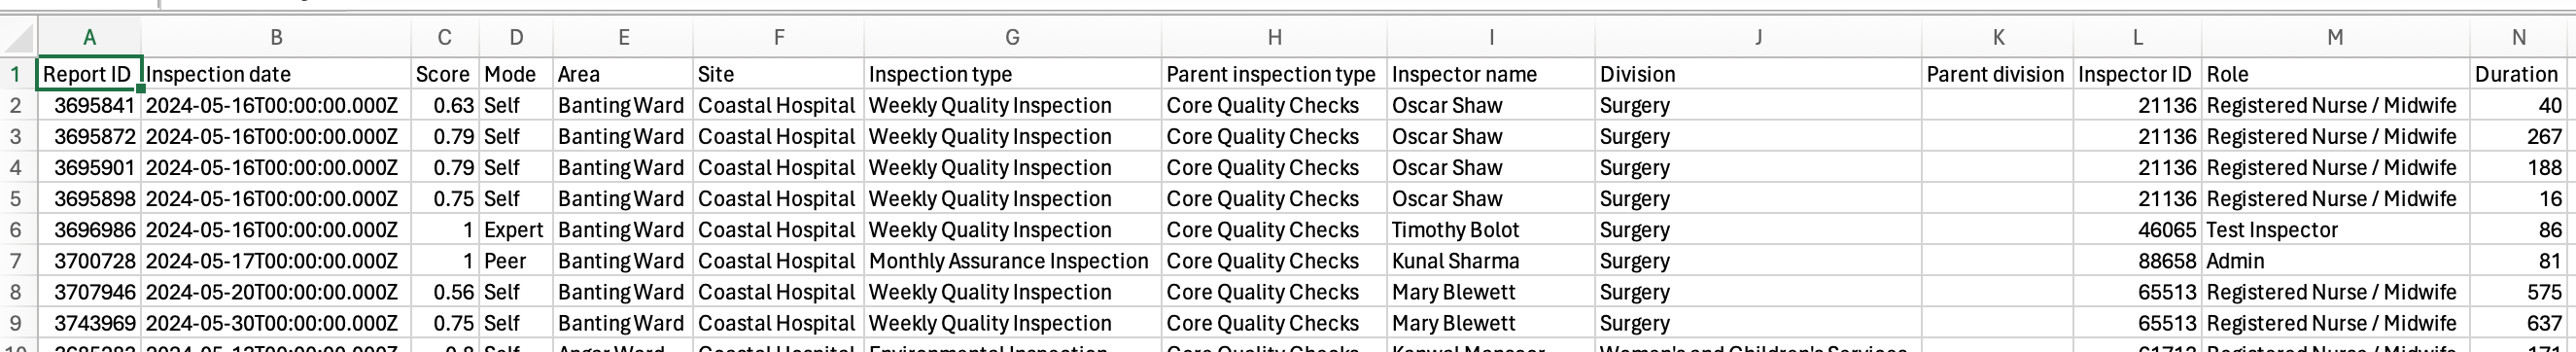
Full data set
Exporting the full dataset shows all of the rows in the underlying data. For example, if there is a chart showing metrics about inspections, the full dataset export would have one row for every inspection included in the chart. In other words, this contains the data that the chart has been based on. Any filters applied on the dashboard will also be applied on the export.
To create this export, select Download on the chart menu and then select Full data set.
Example export:
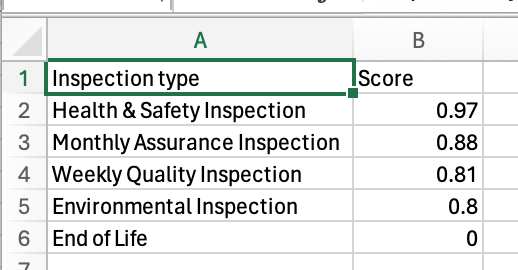
View data set
Exporting a view dataset only shows the metrics that are shown on the chart. For example, if a chart shows the average score by inspection type, the export will have one row for each inspection type with a column for the average score.
To create this export, select Download on the chart menu and then select View data set.

Example export:
Was this article helpful?
That’s Great!
Thank you for your feedback
Sorry! We couldn't be helpful
Thank you for your feedback
Feedback sent
We appreciate your effort and will try to fix the article