Goal Lines
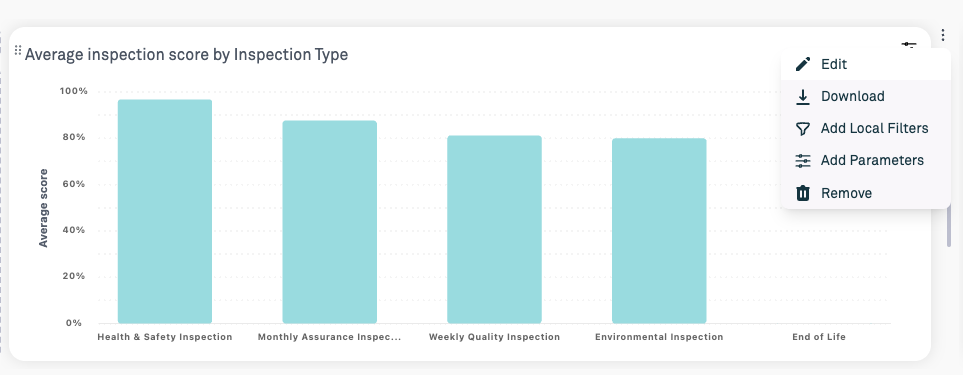
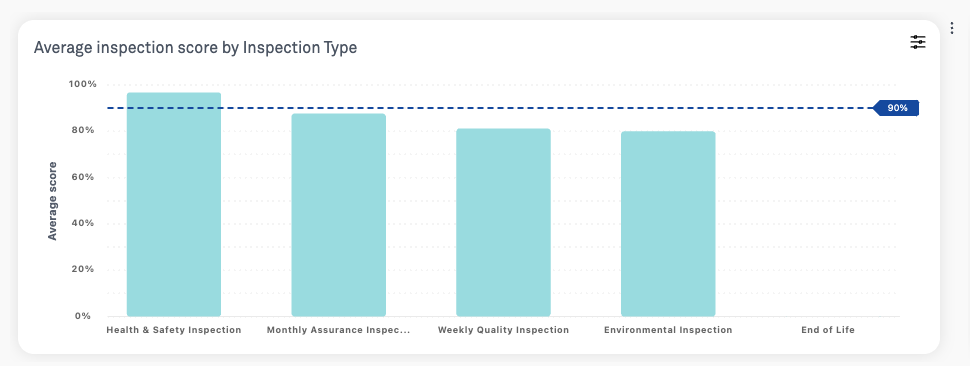
You can add one or more lines to a chart to indicate a goal. For example, you may set a threshold for inspection score which will be overlaid on the results.
To add a goal line, you must customise the chart. This can be from a chart you create yourself or from a chart from the chart library.
1. Click the edit button next to the chart
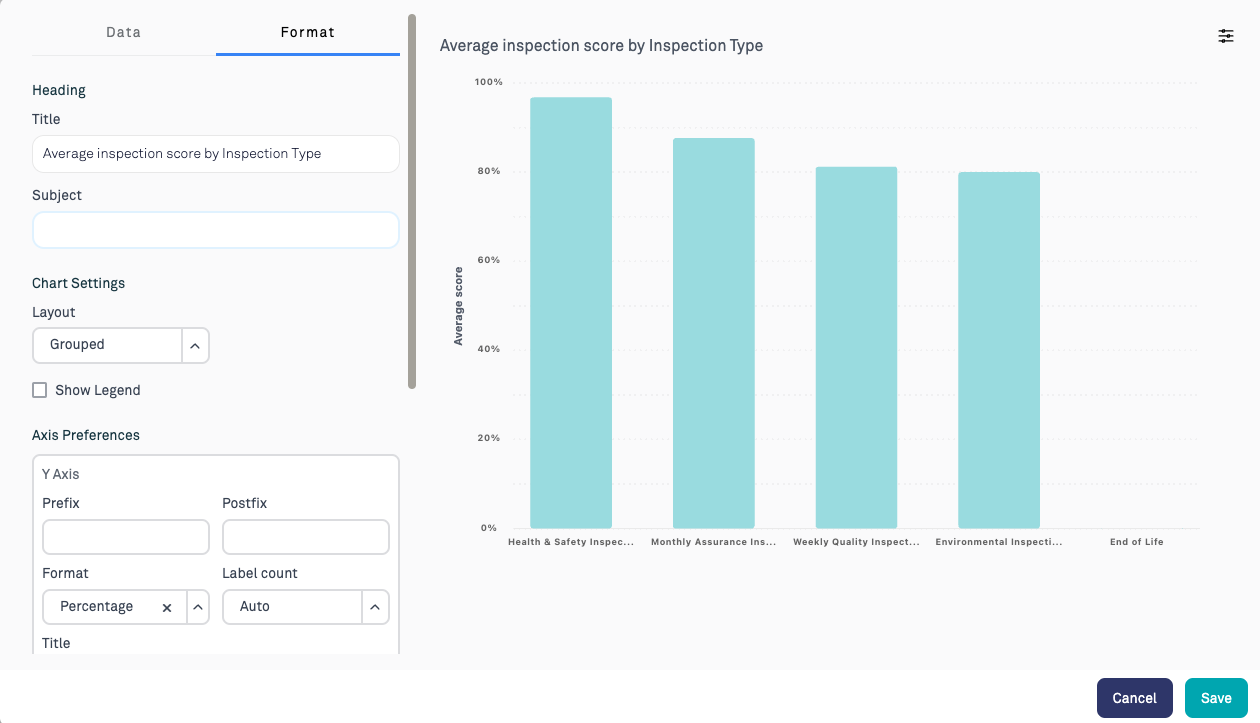
2. Select the Format tab in the chart editor
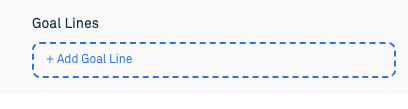
3. Click the add goal line button
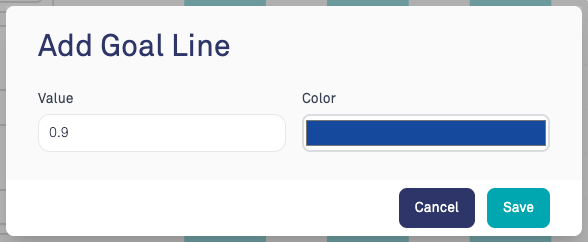
4. Set a threshold for the goal line. If using a percentage axis, the value should be between 0 and 1 - for example 80% would be 0.8. You can also customise the colour of the line.
5. Save the chart to see your goal line
Was this article helpful?
That’s Great!
Thank you for your feedback
Sorry! We couldn't be helpful
Thank you for your feedback
Feedback sent
We appreciate your effort and will try to fix the article