Conditional formatting on charts
You can apply conditional formatting to a chart or table to show certain values in a different colour. This can be used as a form or red-amber-green (RAG) rating where you can define the thresholds, but can be flexibly used for any type of colour rating scheme.
To apply conditional formatting on a chart:
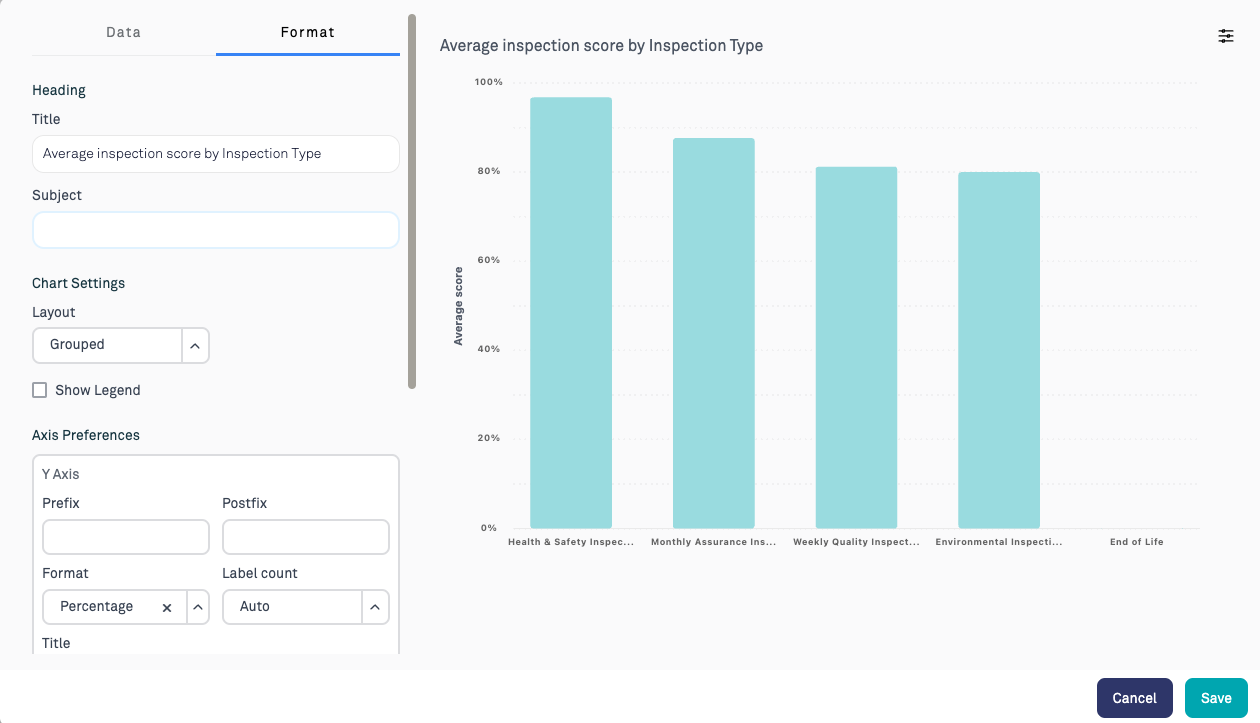
1. Click the Edit button next to the chart

2. Click the Formatting tab on the chart editor
3. Click Add Condition

4. Add the conditional formatting rule by specifying a rule and a colour. Any chart elements which match this rule will have the colour applied.
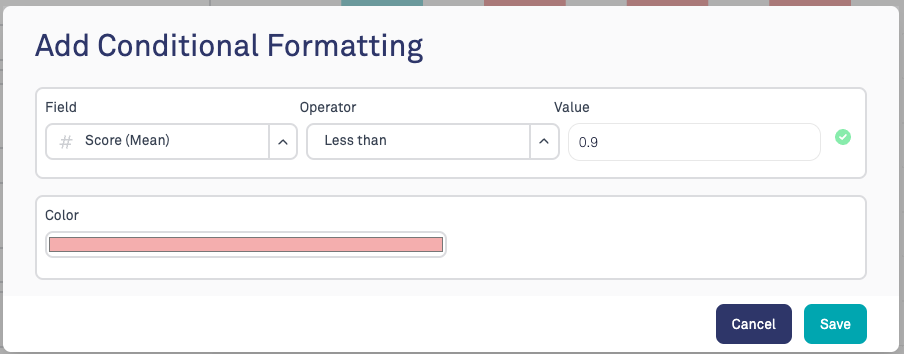
5. In this example, when the average score is < 90%, it is coloured red. Note that percentages should be specified as a decimal between 0 and 1, where 1 is equivalent to 100%.

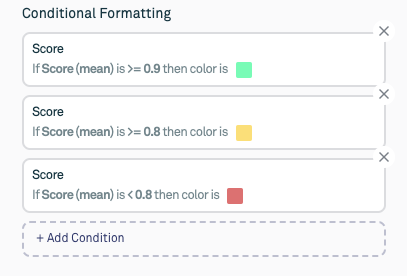
6. Multiple rules can be applied, in which case the first matching rule will be applied. You can drag and drop the rules to change the ordering if necessary. If using this for RAG rating, apply the rules with 'greater than' operators, with the highest rating first.
For example:
Some charts in the library come with a default RAG rating. You can amend the thresholds by editing the chart and following these steps.
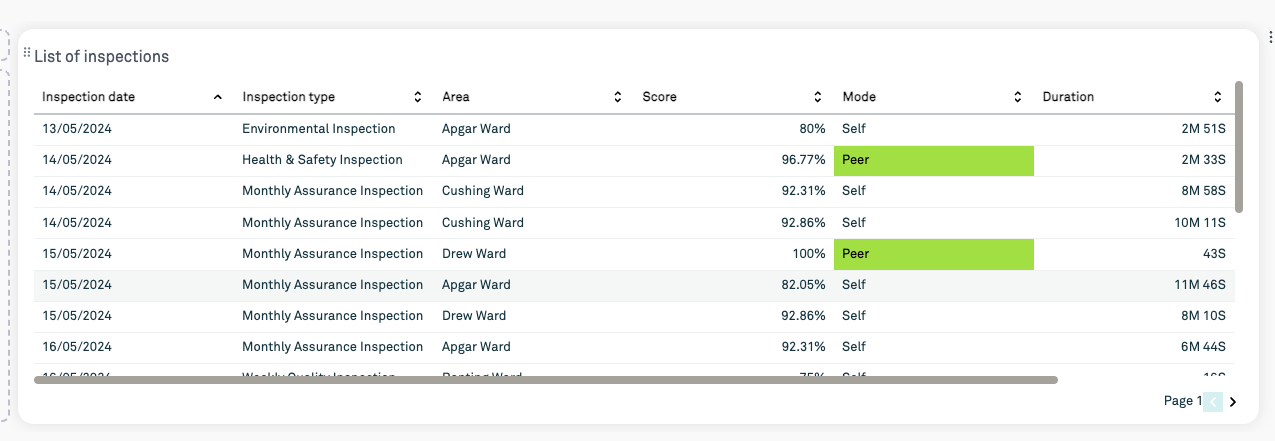
Conditional formatting on tables
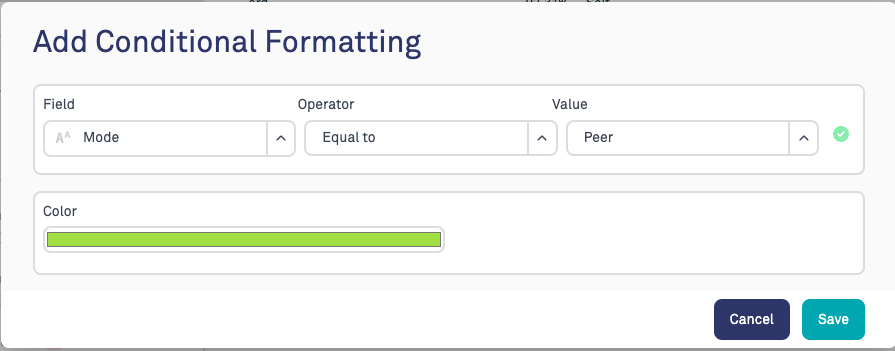
Conditional formatting can also be applied to tables by following the same steps. Any rules will set the background colour of that cell.
In this example, any peer inspection in the list of inspections is coloured green
Was this article helpful?
That’s Great!
Thank you for your feedback
Sorry! We couldn't be helpful
Thank you for your feedback
Feedback sent
We appreciate your effort and will try to fix the article